Location lapse
Digital Cartography through 4 Years of Location Data
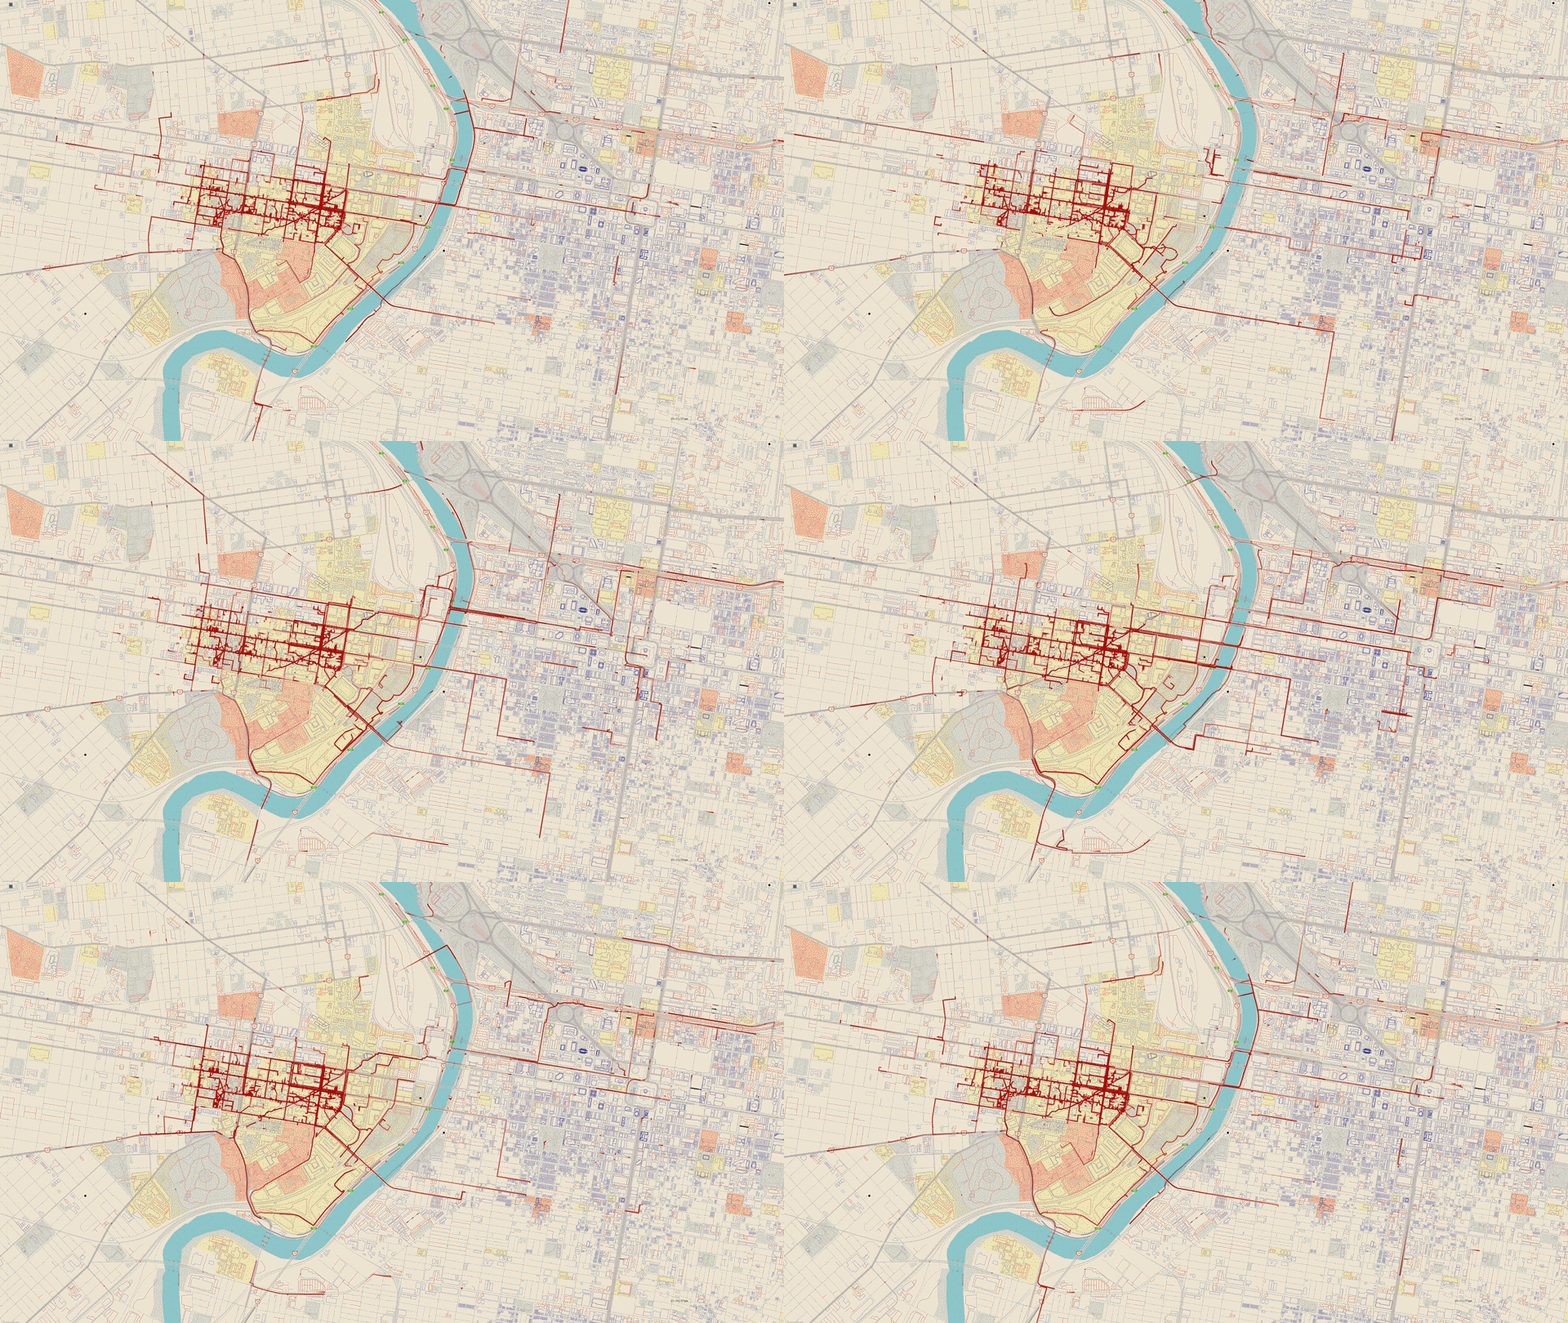
A typical hour in Philadelphia. Left of the Schuylkill River is University City, where I spent the majority of my time.
I’ve been thinking a lot about digital portraits and seeing things from a distance to understand an experience up close. This is a first attempt.
Philly is an old city, so the map styling is based off Saman Benrud’s “Standard” Mapbox, which interprets Standard Oil’s early prints.
All red movement is a past me.
I’ve been sitting on this project for a while. I granted Google Maps my location data halfway through freshman year, knowing one day I could build a visualization to aggregate where it’d all end up—or, more literally, where I’d end up.
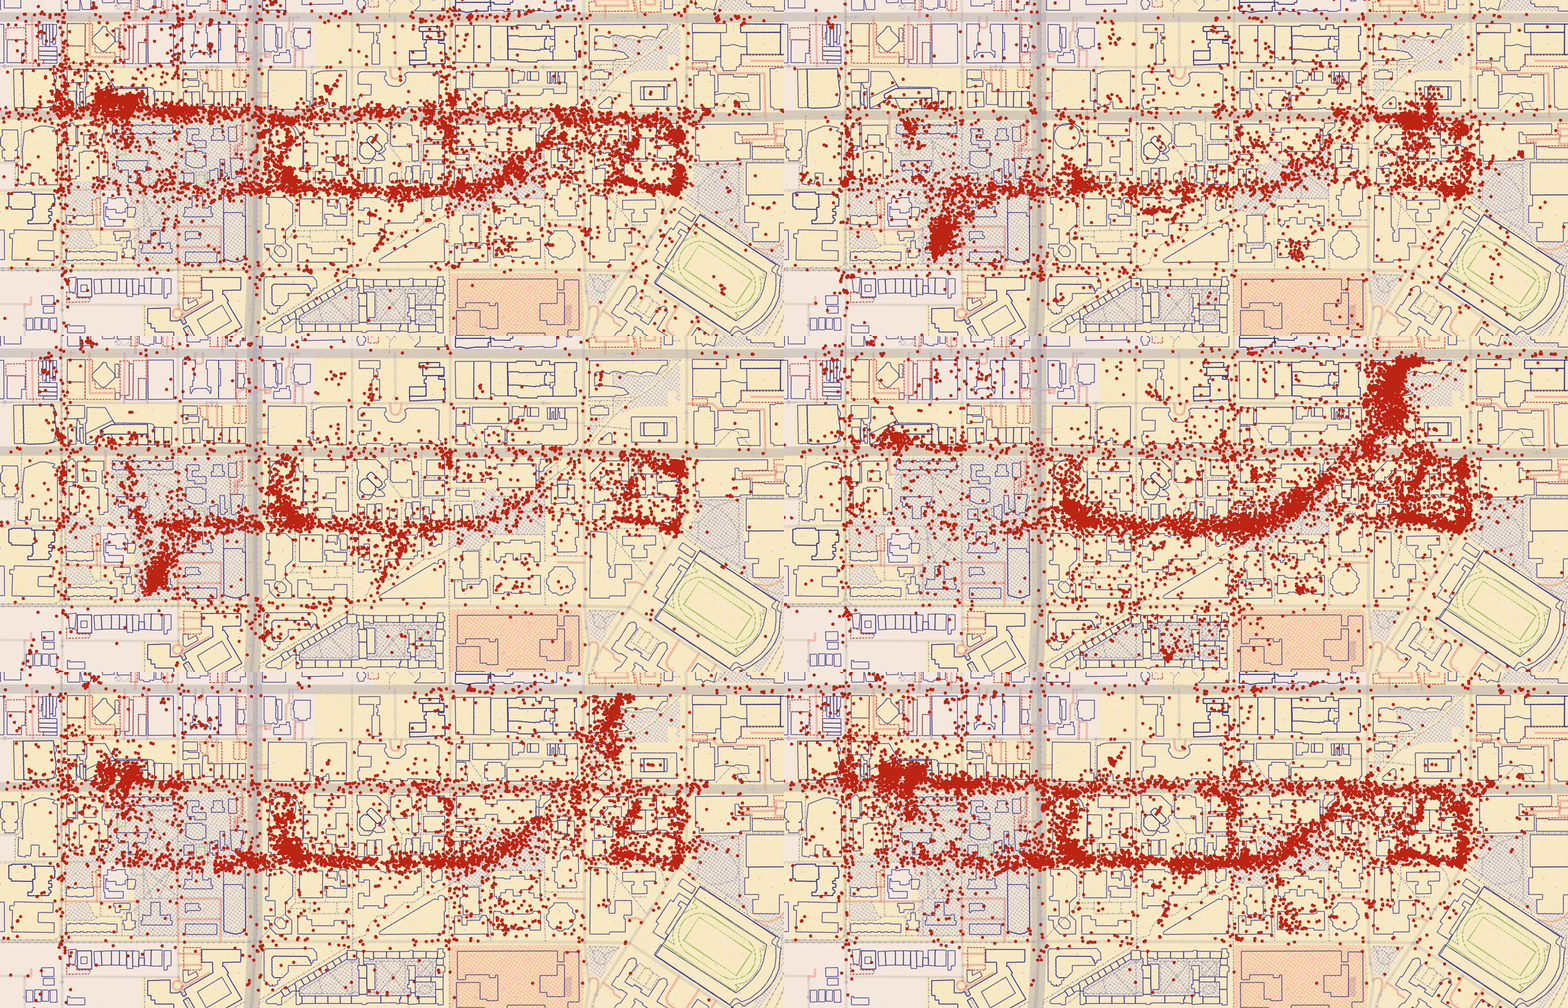
A first-pass at the clumps of data at Penn through time.
The NE block is where I lived Freshman and Junior Year, and the West third is where I lived Sophomore and Senior year. The line through the middle is Locust Walk, which connects Wharton on the West with Engineering on the East.
Extruding this info shows density, giving me stats on how much of college I spent away from my dorm, in class or even skipping class, running between Huntsman and E-Quad, etc.. Fun facts: over 4 years, I traveled 7,410 kilometers, or 4604 miles. This translates into an average of 7.4 miles per day, of which I walked an average of 5.1 miles per day. My laziest days were Sunday, where I usually wouldn’t leave the dorm until 1pm. By the end of college, the time I got back to my dorm was pushed back nearly 2 hours compared to the freshman year. All these stats have to be verified (it’s 3am right now so the code may not be right). I wonder what insights would come if I interpolated my info into a vector field then computed divergence and curl out of hotspots.
I want to turn all this info into a talk one day about how college changed me at a circadian level, but we’ll save that for later. Information is beautiful, even though location tracking is a little concerning. A standard neural net could probably predict my location with high accuracy. I’ve since turned off my location history.
Other random info:
This project was meant be a 2 day build, but I ended up spending more than 2.5 weeks on this. Data wrangling took a lot longer than I had expected. Oh well, time is meaningless in the era of COVID.
Technically, this page has 3 titles. The HTML title tag, “Where Do We Go From Here?” is a song by Chris Rene I listened to at the end of middle school. I kept humming it while coding.
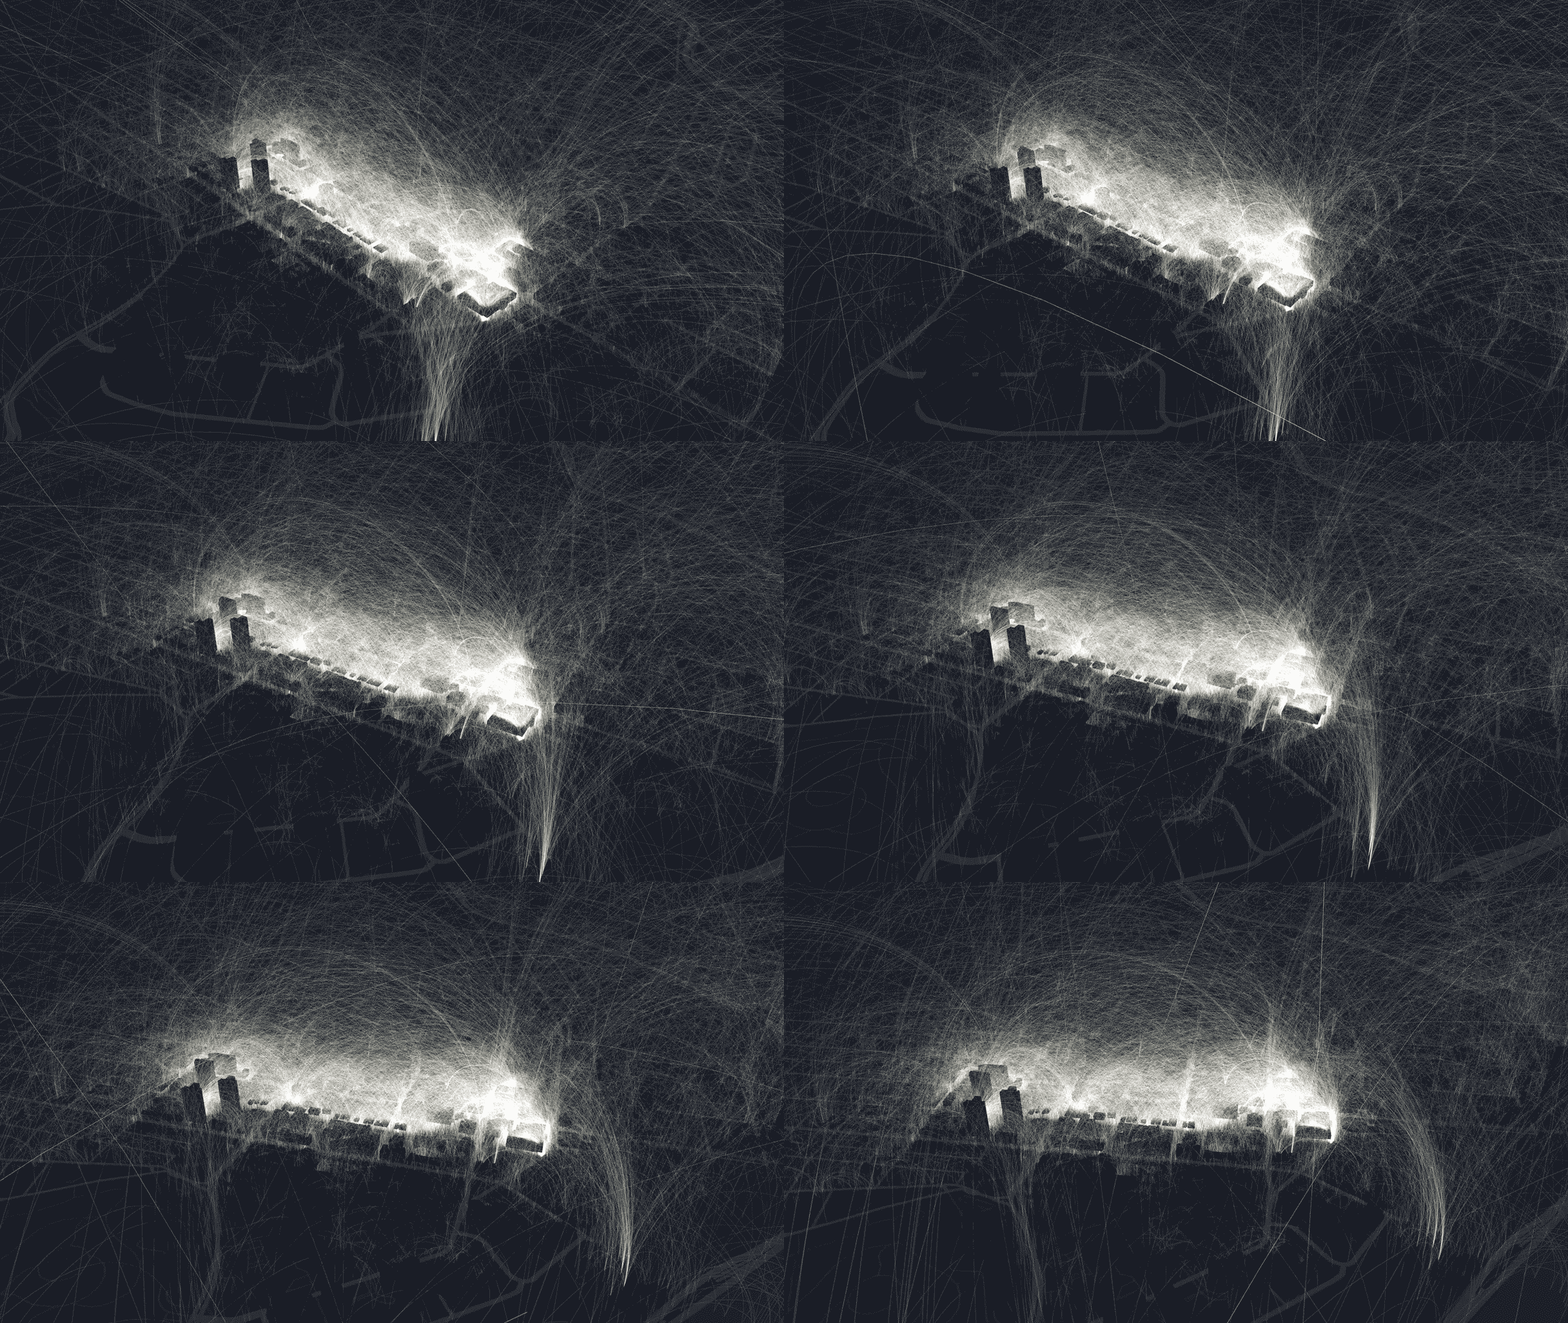
If we ignore Philadelphia’s historical status and turn off the lights, our data can breathe a new life. Saving the full version of these as screensavers and wallpapers is very calming.


